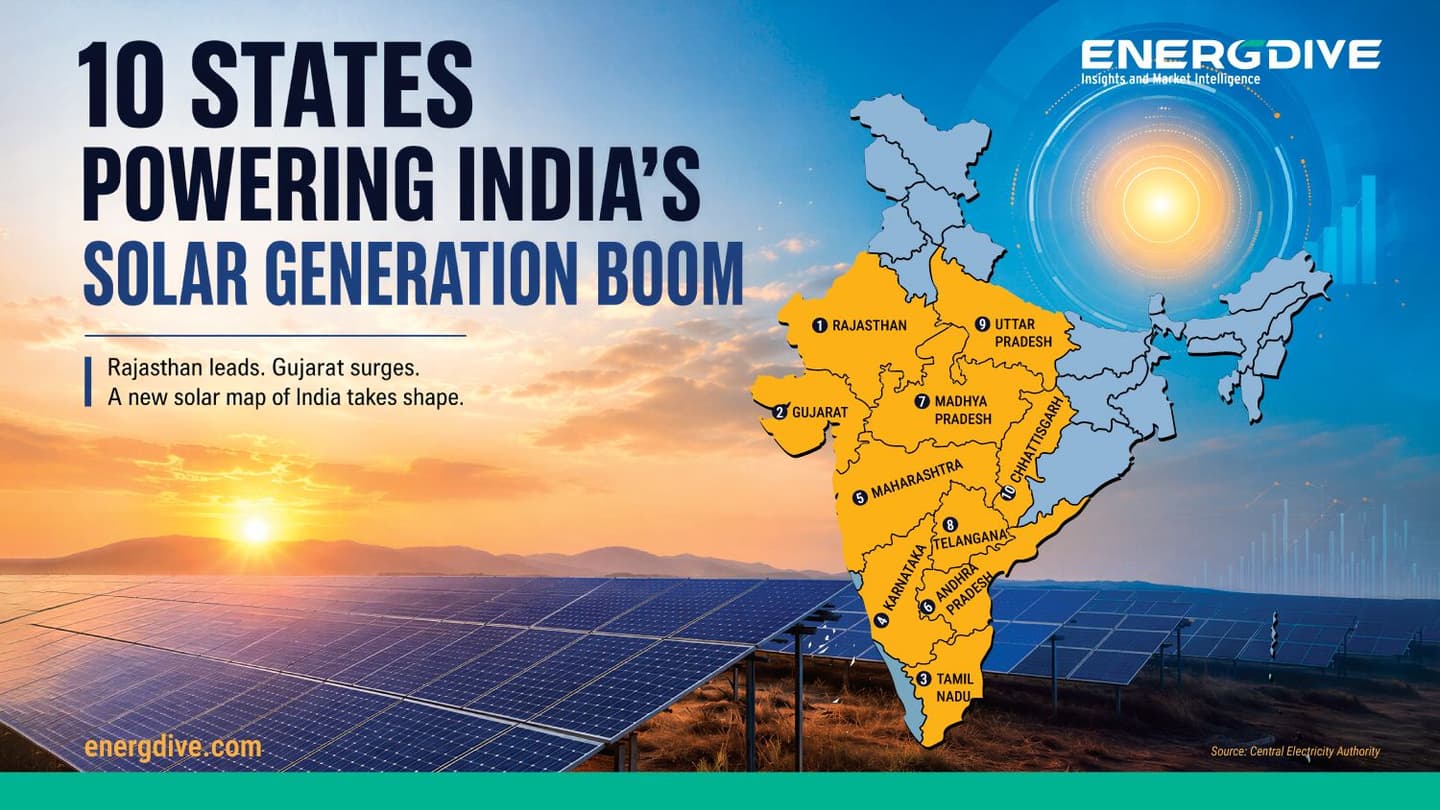
The following states are driving India’s solar generation in the first quarter of FY 2026–27:
1. Rajasthan: The Leader
April–June 2026: 19,418 MU
April–June 2025: 15,915.29 MU
Growth: 22 percent
Rajasthan continues to be numero uno in India’s solar generation landscape. It generated 19,418 MU during April–June 2026, which is over 30 percent of the national solar tally. The state’s output exceeded 5,000 MU. This is higher than Gujarat, the second largest generator. This scale reflects Rajasthan’s established position as the country’s leading utility-scale solar market, supported by its large solar resource and extensive project development. The state’s generation in June alone reached 6,450.20 MU compared with 4,875.69 MU same month last year.
2. Gujarat: Scripting the Biggest Growth Story
April–June 2026: 14,319 MU
April–June 2025: 5,926.84 MU
Growth: 141.6 percent
No other major solar producing state in the country recorded a comparable jump. During the quarter, the solar generation in Gujarat soared by over 8,392 MU year-on-year (YoY). This catapulted it from a distant second to a position where it commanded a more significant share of national output. The state’s generation in June was 4,550.16 MU vis-a-vis 1,559.78 MU in June 2025, which is an increase of about 191.7 percent.
3. Tamil Nadu: The Southern Powerhouse
April–June 2026: 6,369.25 MU
April–June 2025: 4,719.61 MU
Growth: 35 percent
Tamil Nadu was India’s third largest solar generation during the quarter. Its output increased by around 1,650 MU YoY. The state’s generation in June reached 2,165.72 MU compared with 1,590.65 MU a year earlier. Its significance extends beyond solar, as its established wind-energy base makes it one of the country’s most diversified renewable energy markets.
4. Karnataka: Rapidly Emerging Market
April–June 2026: 5,958.86 MU
April–June 2025: 4,099.74 MU
Growth: 45.3 percent
During the quarter, Karnataka generated almost 6,000 MU of solar electricity. This places it fourth pan-India. The state’s output increased by almost 1,860 MU YoY. Its generation in June touched 1,781.45 MU compared with 1,191.49 MU in June 2025. The southern state’s position is particularly significant as it has developed one of the country’s largest renewable energy ecosystems. This makes it an important market for both solar generation and renewable integration.
5. Maharashtra: Large Industrial-Driven Demand
April–June 2026: 3,554.08 MU
April–June 2025: 2,278.21 MU
Growth: 56 percent
Maharashtra’s solar generation grew by over half during the quarter. The state produced 3,554.08 MU compared with 2,278.21 MU during April–June last year. Its June generation alone reached 1,119.10 MU, up from 710.79 MU. The importance of the western state goes beyond generation, as Maharashtra is one of the country’s largest electricity consuming states, giving solar development particular significance for meeting demand from its large industrial and commercial base.
6. Andhra Pradesh: Promising Project Pipeline
April–June 2026: 3,198.42 MU
April–June 2025: 2,205.60 MU
Growth: 45 percent
Andhra Pradesh crossed the 3,000 MU mark during the quarter. While the state’s June output reached 985.19 MU, compared with 689.15 MU in June 2025, its solar generation increased by almost 993 MU YoY. The state’s large renewable energy potential and project pipeline make it one of the southern markets worth watching as India’s solar industry.
7. Madhya Pradesh: The Emerging Contender
April–June 2026: 2,653.11 MU
April–June 2025: 2,066.25 MU
Growth: 28.4 percent
During the quarter, Madhya Pradesh generated 2,653.11 MU, an increase of nearly 587 MU YoY in output. The central Indian state’s generation in June touched 886.18 MU, compared with 556.49 MU in June 2025. Adding geographic depth to India’s solar market, the state shows that significant generation is not restricted to Rajasthan, Gujarat and the southern renewable energy leaders.
8. Telangana: A Growing Southern Contributor
April–June 2026: 2,206.93 MU
April–June 2025: 1,829.28 MU
Growth: 20.6 percent
Telangana generated over 2,200 MU during the quarter. It generated 741.71 MU compared with 558.99 MU vis-à-vis June 2025. While its output is well below the country’s four leading states, Telangana’s position in the top 10 demonstrates the growing geographical spread of solar generation across southern India.
9. Uttar Pradesh: On an Ambitious Growth Path
April–June 2026: 1,750.70 MU
April–June 2025: 1,476.82 MU
Growth: 18.5 percent
In the top-10, Uttar Pradesh ranks second among northern states after Rajasthan. Uttar Pradesh’s generation was 1,750.70 MU during April–June, up from 1,476.82 MU a year earlier. Its June generation reached 553.25 MU, compared with 431.29 MU in June 2025. With its large electricity demand and expanding renewable energy ambitions, the state’s solar development has significance beyond its current generation ranking.
10. Chhattisgarh: Growth from a Smaller Base
April–June 2026: 691.53 MU
April–June 2025: 456.74 MU
Growth: 51.4 percent
Chhattisgarh completes the top 10. Its quarterly solar generation increased by more than 234 MU, representing growth exceeding 51 percent. The state’s absolute generation remains well below the national leaders . However, the rate of increase is significant.
India’s solar story is often reduced to one number, installed capacity. However, the latest generation data shows a more nuanced aspect. Solar generation increased 45.9 percent in April-June this year, but 95.7 percent of reported output came from just 10 states. Rajasthan continues to dominate and Gujarat’s extraordinary increase is beginning to reshape the hierarchy.